Where can the asset work?
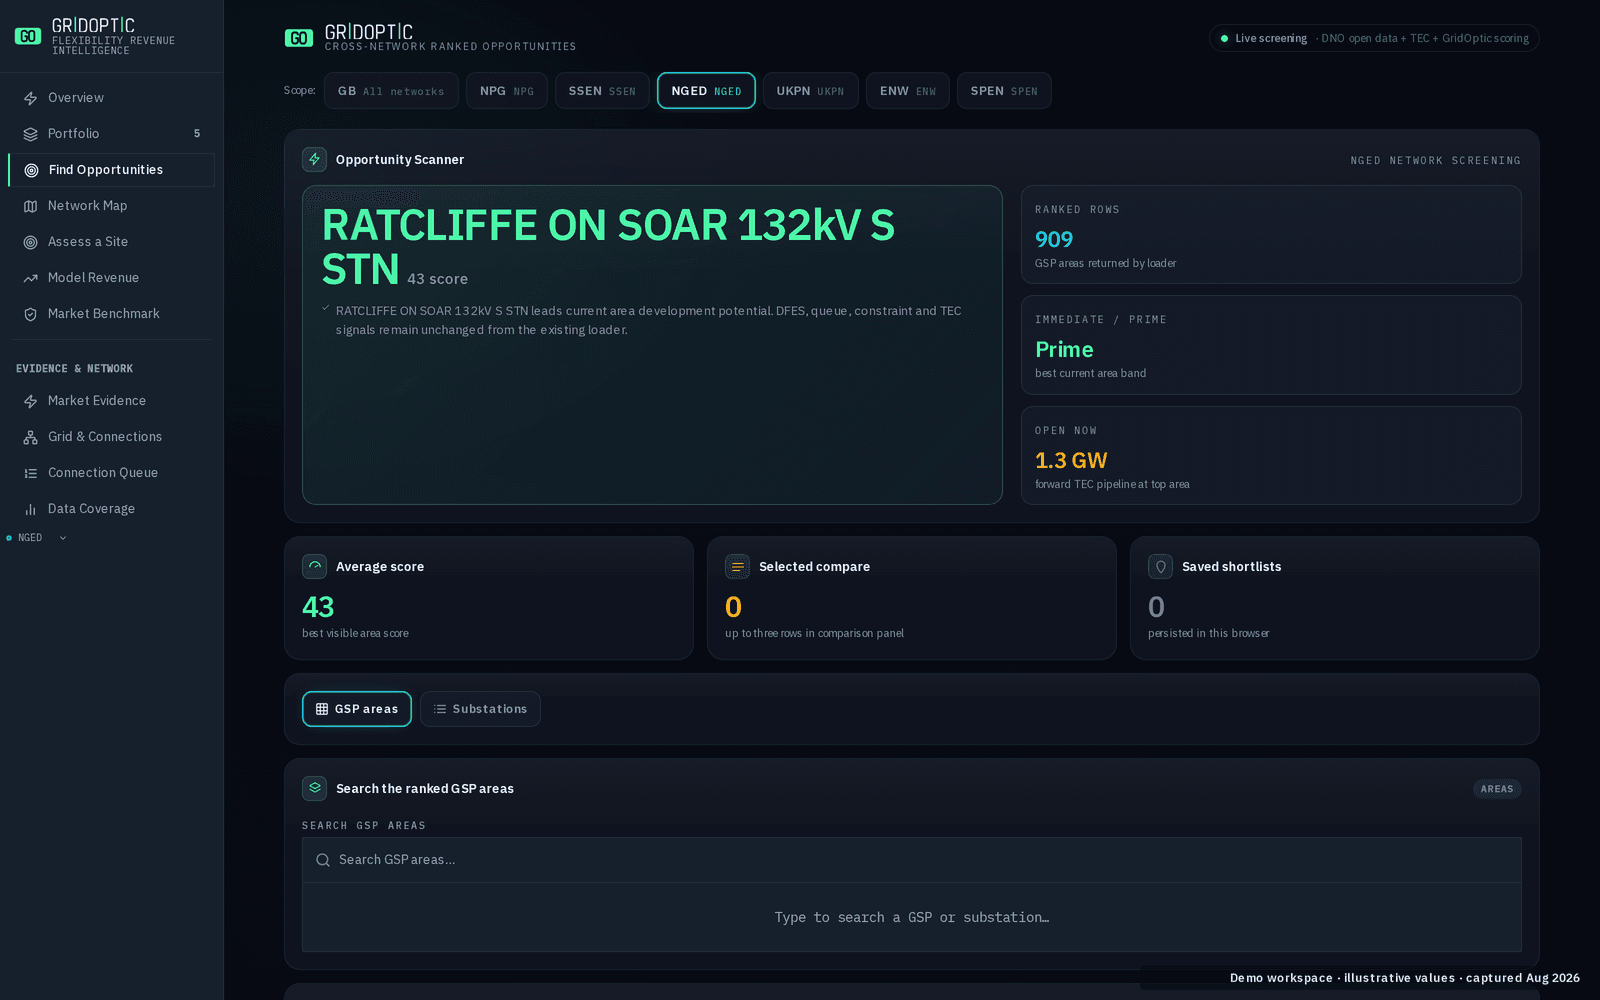
Screen network headroom, connection pressure, constraints and future demand across GB.
One trustworthy answer for siting, pricing and underwriting grid assets — built from GB distribution network operator (DNO) and NESO (the national energy system operator) open data.
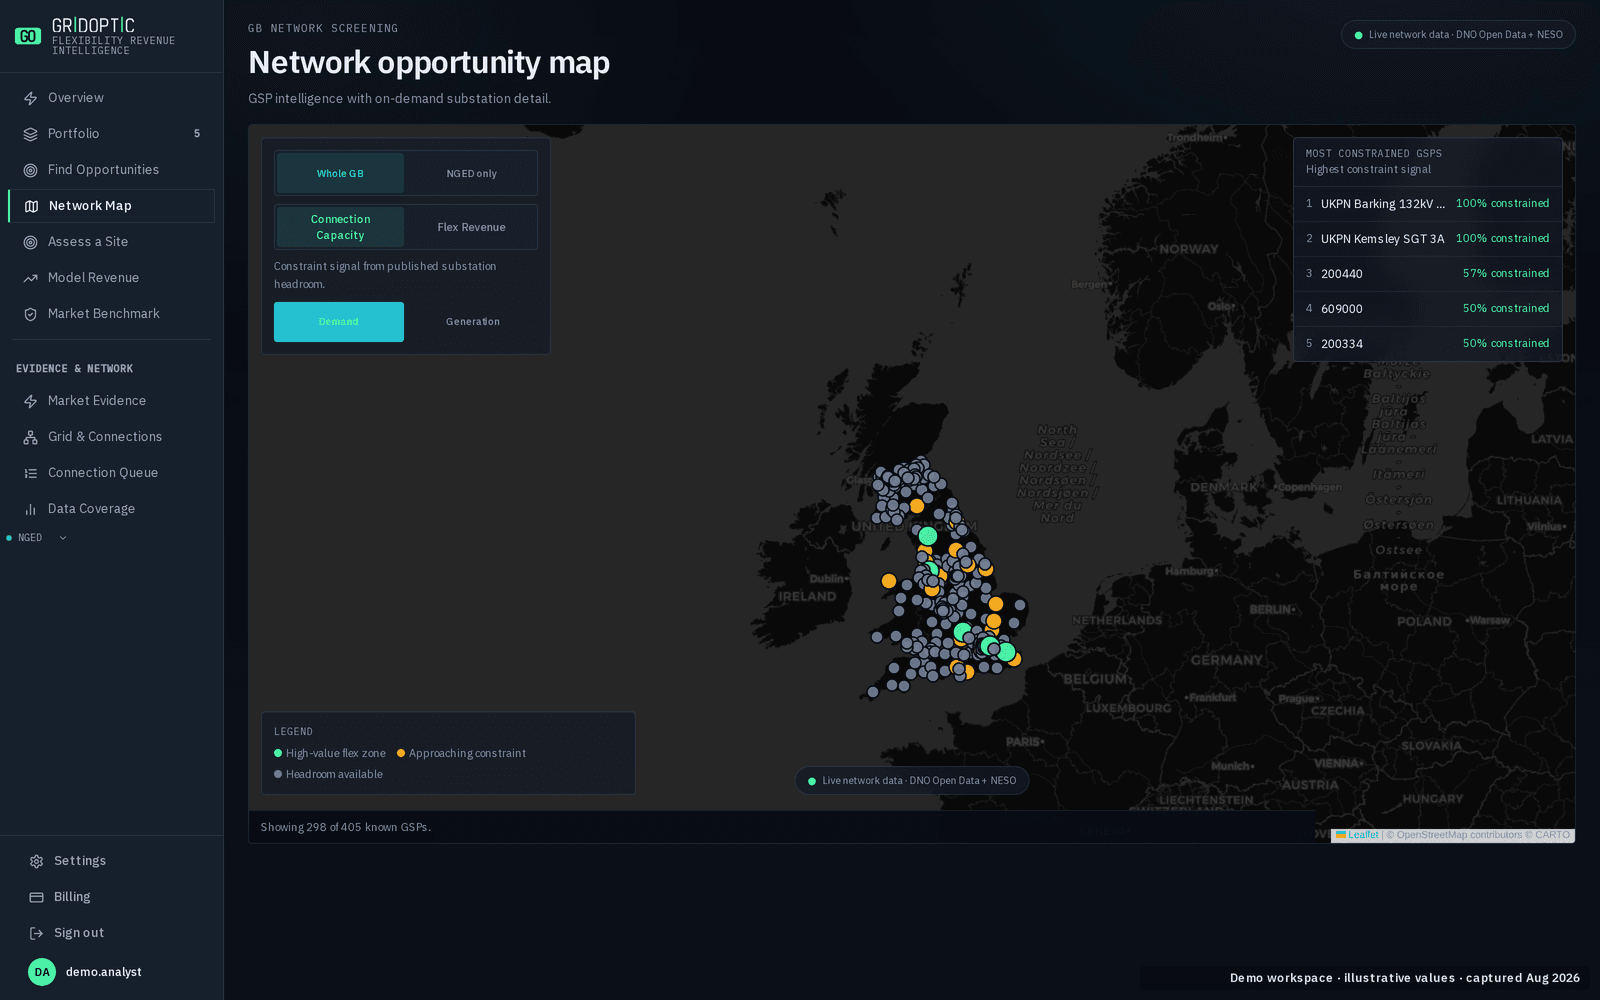
A grid supply point (GSP) is where the transmission system hands over to a distribution network — the boundary that decides which capacity, requirement and queue apply. This is GridOptic's own registry, plotted from real published coordinates.
298 of 405 known grid supply points, plotted by published coordinate across NPG, NGED, UKPN, SSEN, ENW and SPEN. The rest are known by name but not yet geocoded by their publisher.
Three questions decide whether a grid asset deserves more time and capital. GridOptic answers them on one comparable evidence base.
Screen network headroom, connection pressure, constraints and future demand across GB.
Benchmark the local going rate with GO-LFI and build an explicit revenue range.
See sources, timestamps, assumptions and confidence before the number enters a model.
Move between the benchmark, the network and the asset case without losing the source trail.
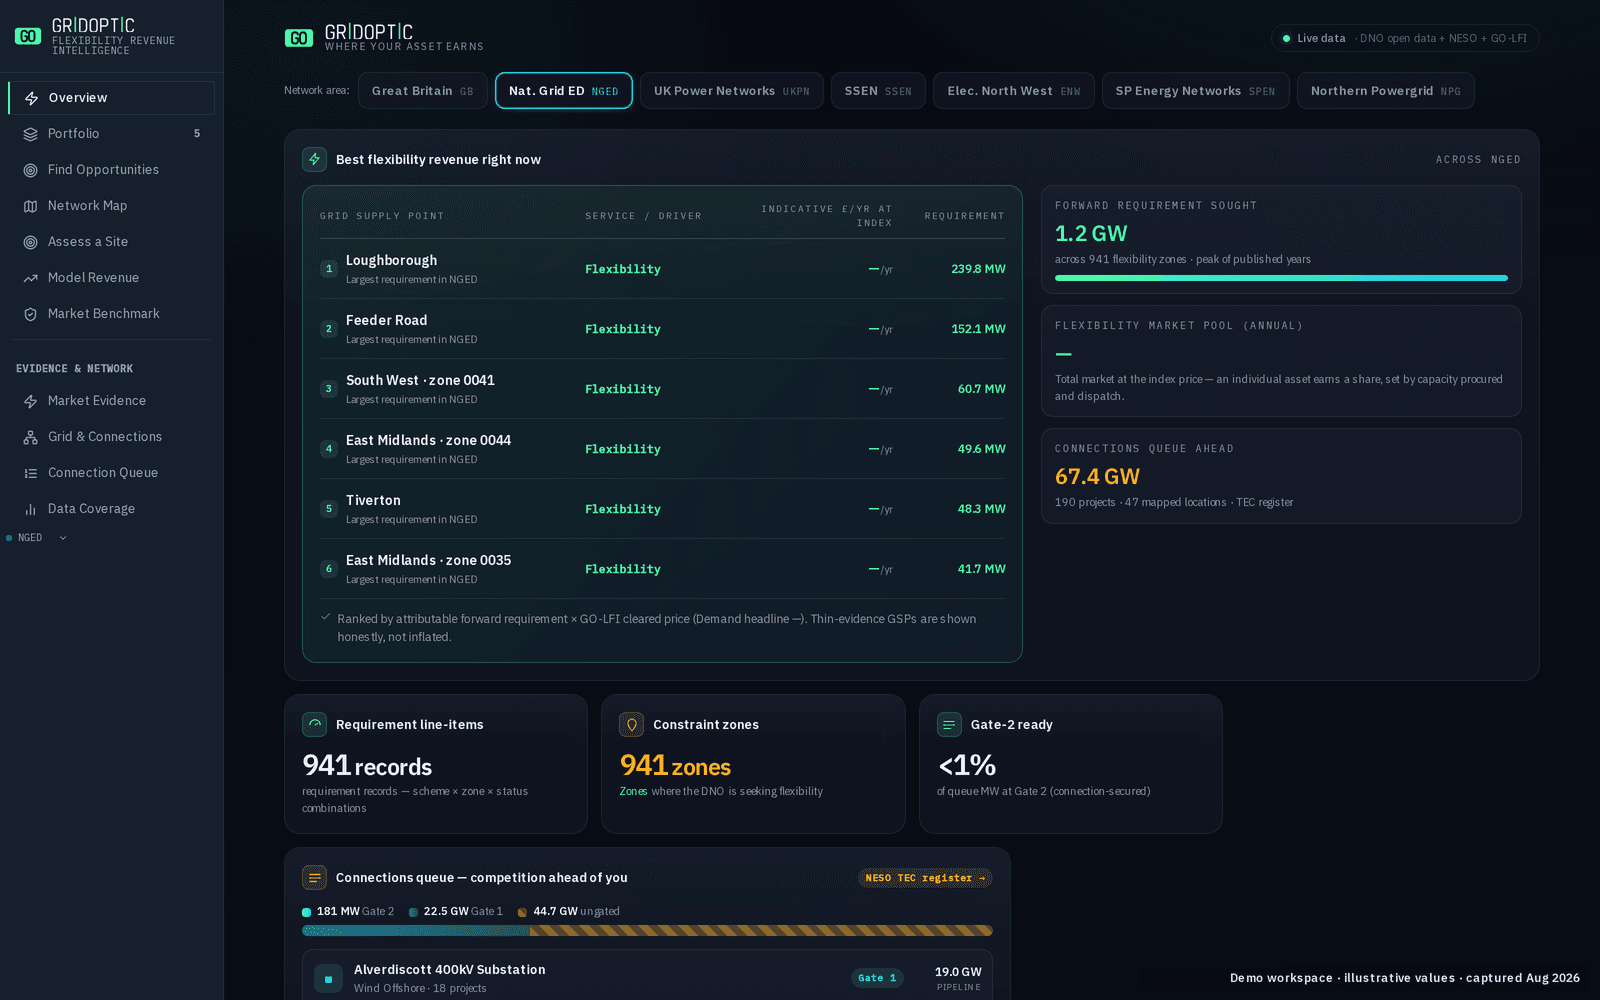
Benchmark GO-LFI (GridOptic Local Flexibility Index) annual revenue per MW by market, location and year from published contract evidence — every value carries price and utilisation confidence.
Explore the GO-LFI indexScan GB capacity, queue pressure, constraints and future scenarios on one normalised map — national opportunity down to grid supply point (GSP) evidence.
Explore network intelligenceThe GridOptic interface, captured from a demo workspace. Network and location names are real; every figure shown is illustrative and does not reflect live data.
Create cautious, expected and upside revenue ranges grounded in GO-LFI. Observed data stays separate from assumptions, with an evidence rating attached.
Explore revenue forecastingBring network, queue, market and asset signals together, compare sites and portfolios on one evidence base, then act where the case is strongest.
See the complete platformThe GridOptic interface, captured from a demo workspace. Network and location names are real; every figure shown is illustrative and does not reflect live data.
Every grid supply point plotted across GB, coloured by constraint signal from published substation headroom — a national picture built from evidence, not a marker on a road map.
Explore GSP intelligenceThe GridOptic interface, captured from a demo workspace. Network and location names are real; every figure shown is illustrative and does not reflect live data.
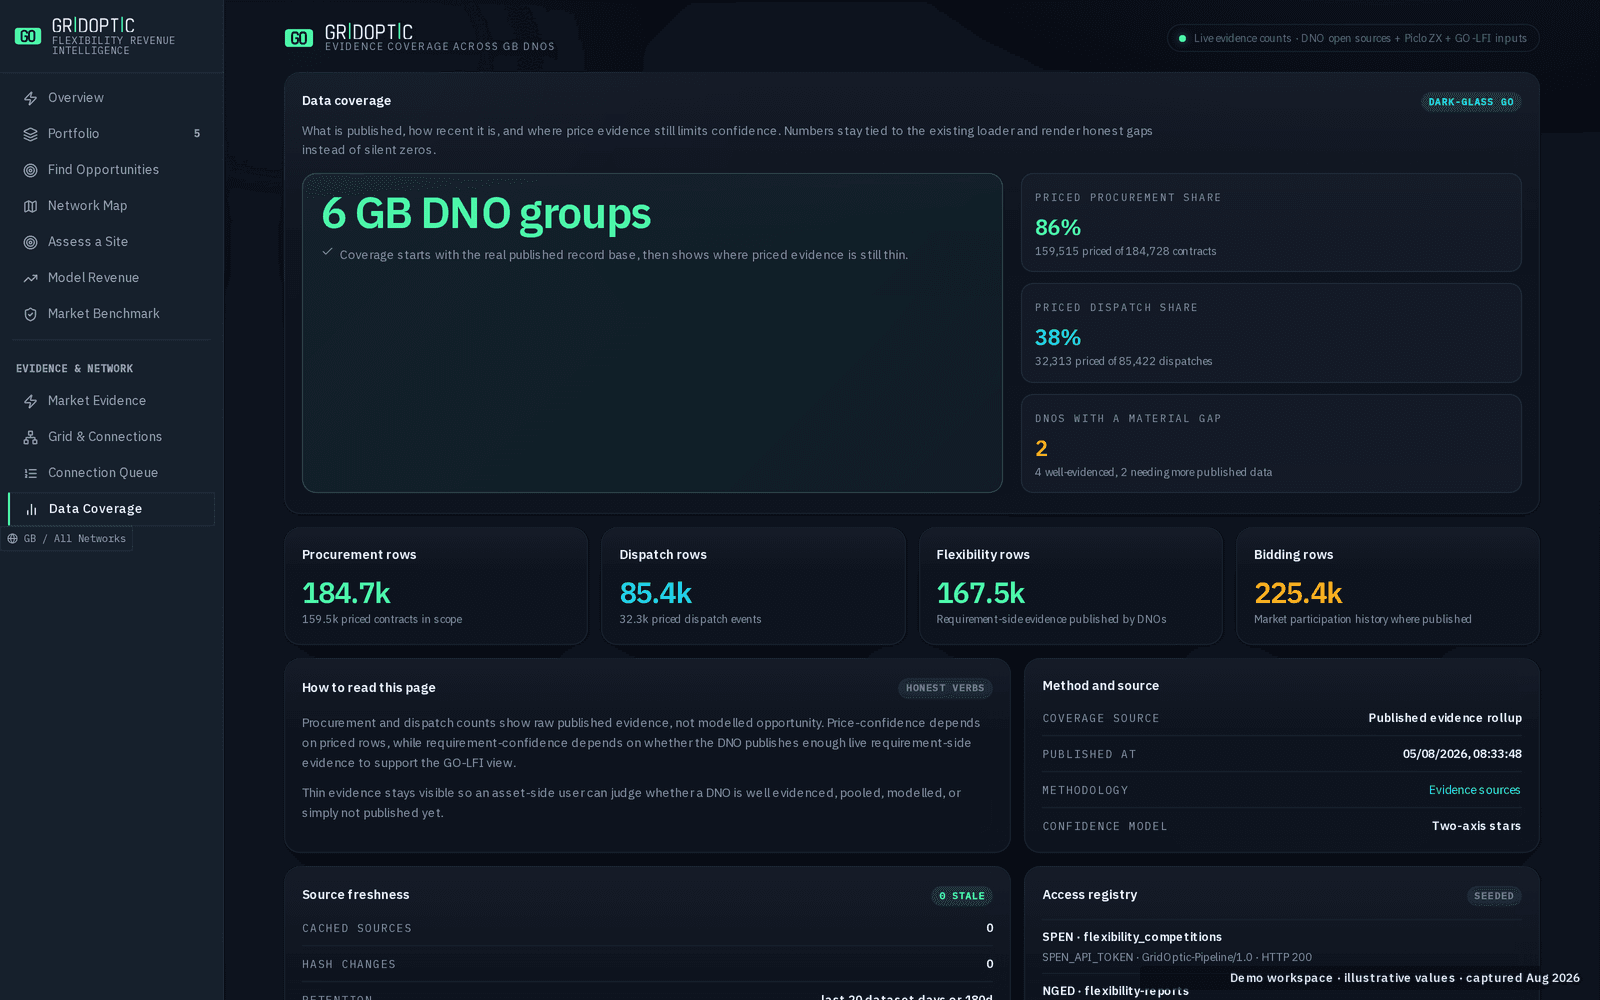
Priced procurement and dispatch share by network, tracked openly — where a DNO has published little, GridOptic shows the gap instead of quietly hiding it.
Explore market evidenceThe GridOptic interface, captured from a demo workspace. Network and location names are real; every figure shown is illustrative and does not reflect live data.
Nothing on GridOptic claims more certainty than the data supports.
Every decision signal keeps its publisher, source file and relevant publication date.
Requirement and price confidence stay separate — shown as 1–5 stars, because they answer different risks.
Weak evidence lowers confidence. Unsupported values are withheld, not made to look complete.
The source trail travels from the first screen into forecast and investment review.
Locate viable sites and price their flexibility case before development spend.
InvestorsBenchmark assumptions and expose confidence before capital approval.
Asset ownersMatch operating assets to local markets and prioritise commercial action.
VPP & DSRMatch flexible capacity from virtual power plant (VPP) and demand-side response (DSR) assets to evidenced local need and value.
Site ownersStart developer conversations with local grid and market evidence.
UtilitiesSee what your customer flexibility portfolio can earn by GSP and DNO.
GridOptic connects published distribution network operator (DNO) data with NESO (the national energy system operator) context to make local opportunities comparable.
Definitions, confidence logic and caveats are explicit. The benchmark can be challenged rather than merely trusted.
NPG · NGED · UKPN · SSEN · ENW · SPEN — named DNO ownership groups covered.
Every record stays linked to the publisher, source file and publication date.
GridOptic’s proprietary Local Flexibility Index: an evidence-rated annual revenue per MW benchmark.
Real record volumes from verified DNO and market sources.
The GridOptic Local Flexibility Index (GO-LFI) is an evidence-rated annual revenue per MW benchmark derived from published flexibility procurement and market records. It is designed to show the going rate without overstating certainty.
No. It is an indicative, evidence-rated range. GridOptic makes the assumptions and confidence visible so teams can use the result proportionately in screening and underwriting.
Published data from all six GB distribution network operator (DNO) ownership groups and NESO (the national energy system operator), including network capacity, connection registers, future energy scenarios (DFES), tenders, contracts and dispatch evidence where available.
Each dataset retains its source publication date. GridOptic updates as source publishers release new files, rather than presenting one misleading universal freshness claim.
Asset-side developers, infrastructure investors, asset owners, virtual power plant (VPP) and demand-side response (DSR) operators, site owners and utility teams making location, revenue and portfolio decisions.
Bring a postcode, coordinates, GSP or portfolio. We will show you what GridOptic can resolve.