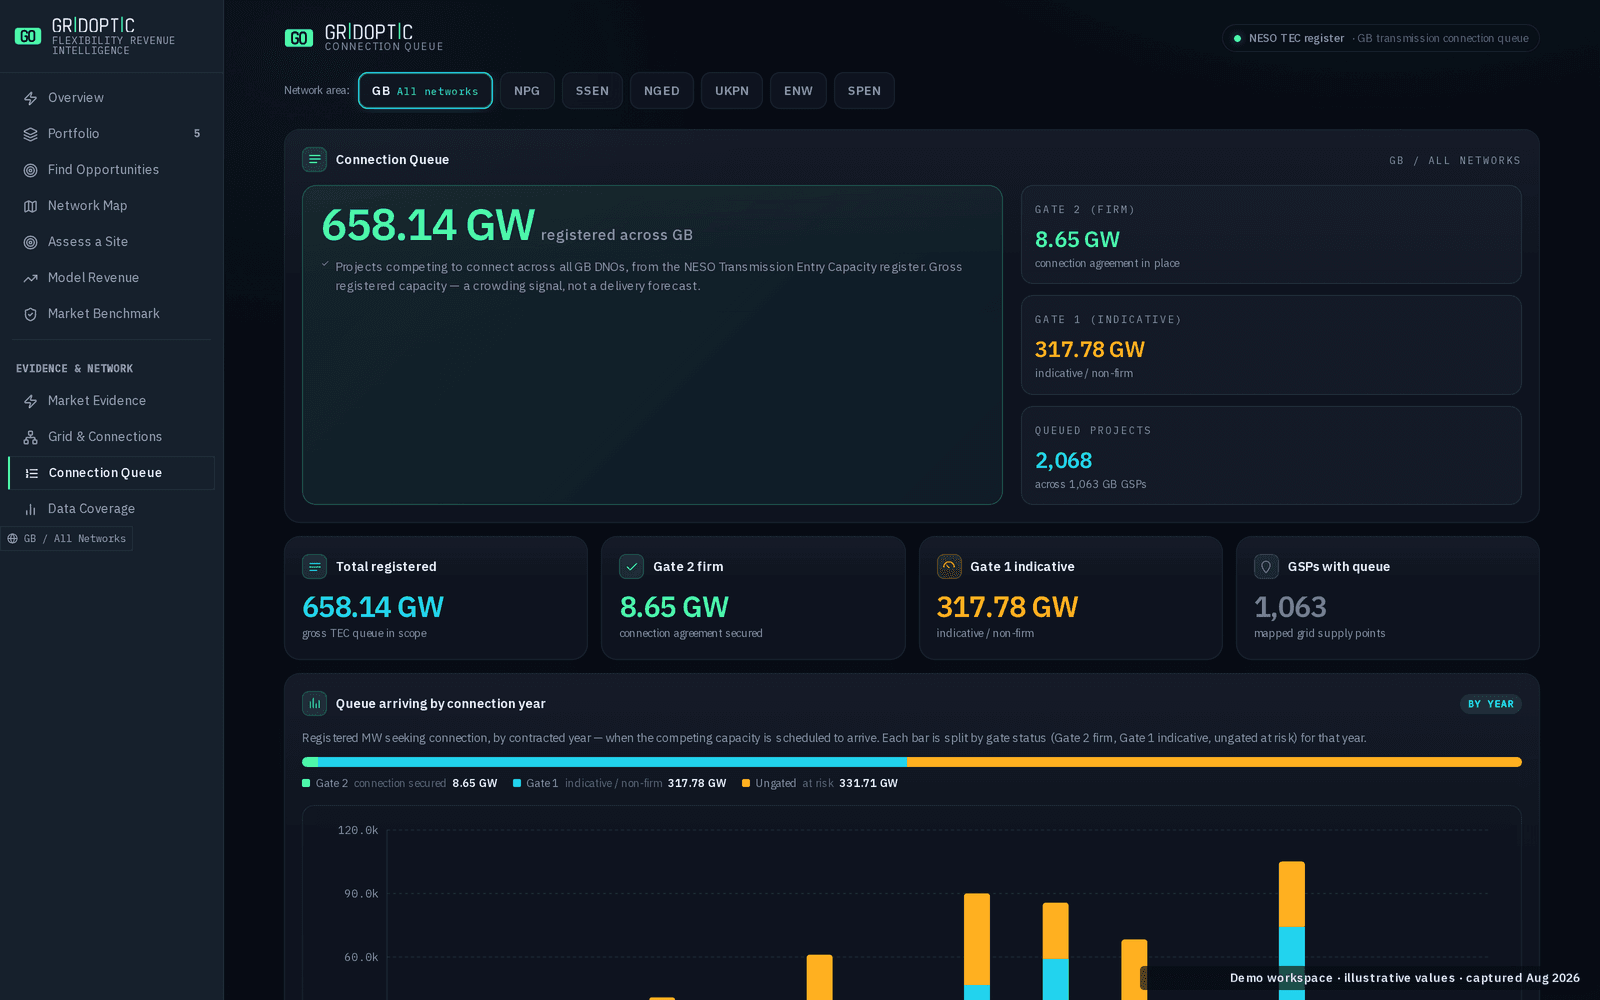
Define the market
Select a network area, technology and capacity range.
Filter published connection registers and transmission queue data into the projects, technologies and dates that matter to your strategy.
The GridOptic interface, captured from a demo workspace. Network and location names are real; every figure shown is illustrative and does not reflect live data.
GridOptic turns inconsistent registers into a searchable market view. Track competing capacity, identify stalled signals and understand how the queue is changing around a target location.
Normalised DNO registers and NESO (the national energy system operator) queue context
Filter by technology, capacity, status and date
Local competitive-pressure signals
Exportable records with source provenance
Select a network area, technology and capacity range.
Review status, timing and concentration around target assets.
Monitor additions and changes as published registers update.
Bring a postcode, coordinates, GSP or portfolio. We will show you what GridOptic can resolve.